Commute to Care: A County-by-County Look at Student Support Access
How geography, school proximity, and local service infrastructure shape care access barriers for children—and what districts can do now.
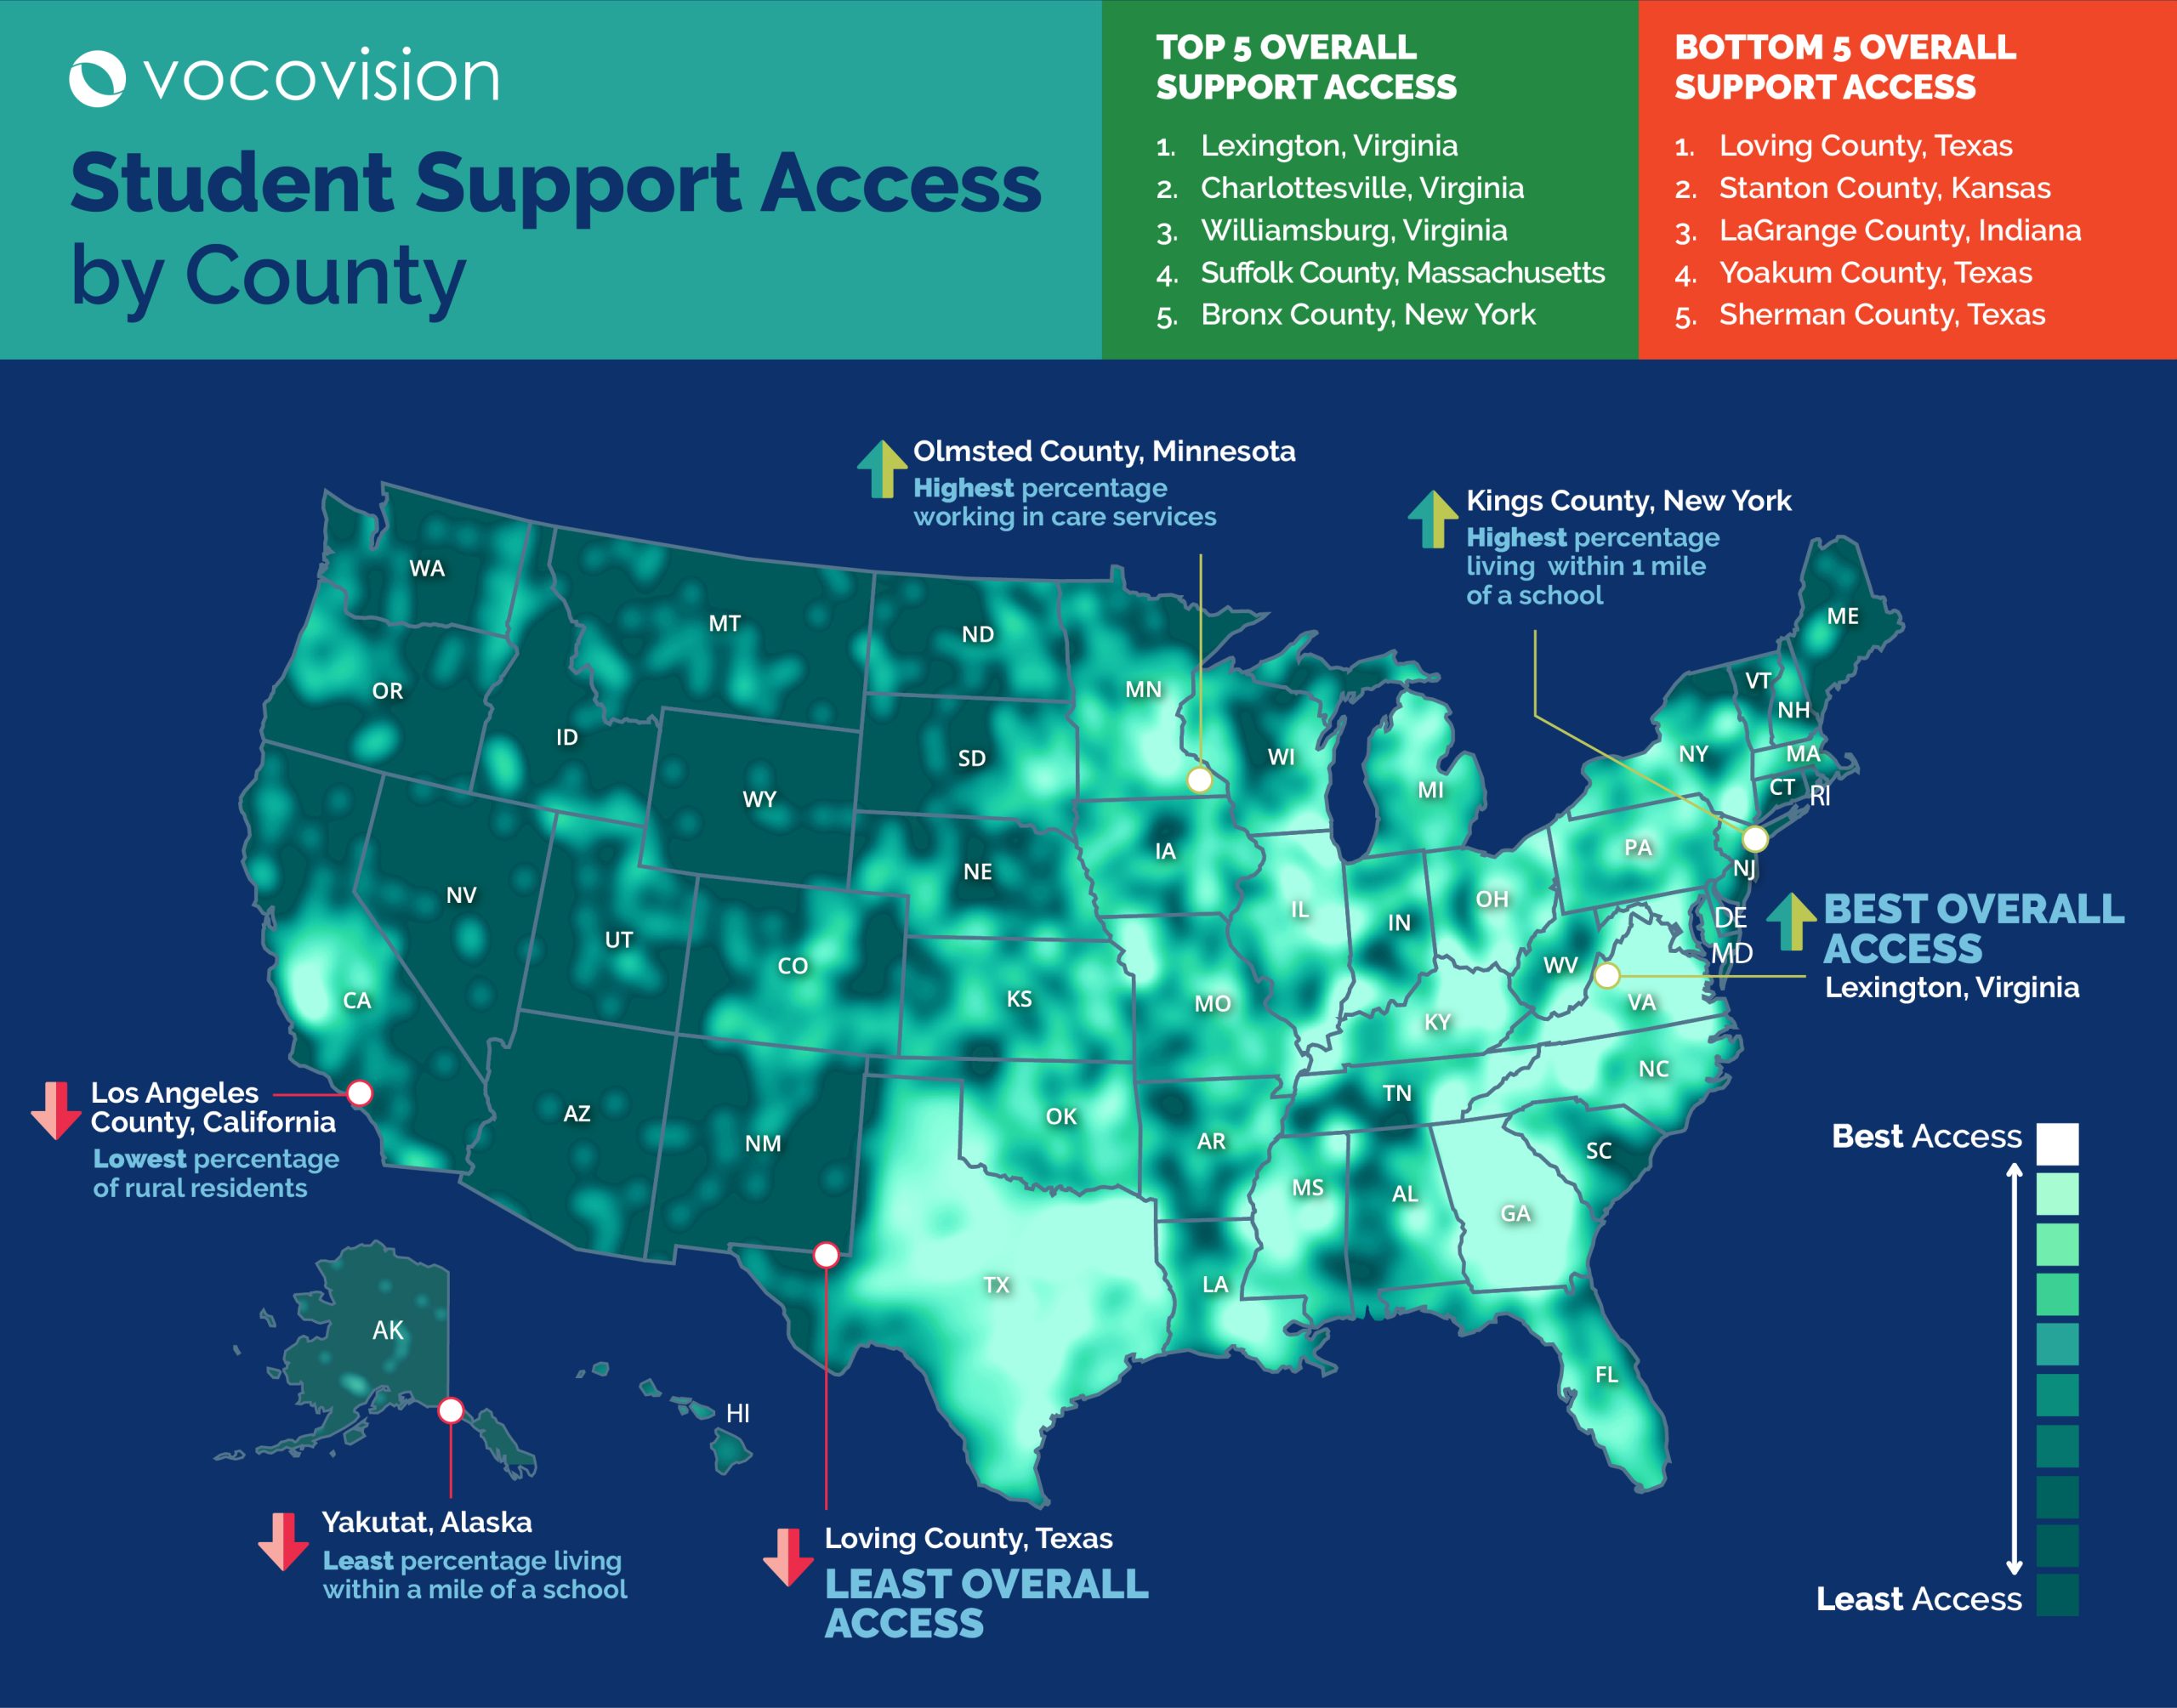
Rural schools across America face some of the biggest gaps in access to specialist student support. Geography, long travel distances, and staffing shortages can leave students in remote areas waiting longer for essential services or relying on fragile local systems that struggle to meet demand consistently.
This report was developed to visualize those gaps at the county level and to clarify a broader point: no student’s access to school-based care should depend on where they live. By ranking counties on structural indicators tied to access, VocoVision’s index identifies where conditions are most likely to create friction for students, families, and districts trying to secure services.
At a Glance
VocoVision analyzed 3,139 U.S. counties to identify where children may face the greatest barriers to accessing school-based support services. Using a county-level index built around school proximity, rural isolation, local care-and-support workforce strength, and the share of children in the population, the analysis shows a stark national divide in access.
The clearest takeaway is that access challenges are driven by compounding structural barriers, not one factor in isolation. The 100 highest-barrier counties in the dataset average:
- 1.7% of residents living within 1 mile of a school,
- are 100% rural by this measure,
- and have only 16.1% of workers employed in education, health care, and social assistance.
In counties where mental health provider data is available, the average provider ratio rises to roughly 1,936:1, signaling limited specialist availability on top of extreme geographic spread. These counties also still have substantial child populations, with an average of 26.1% of residents under 18, reinforcing that the challenge is not low demand, but low infrastructure.
Key Findings
- The county-level divide in student support access is stark. The 25 counties facing the greatest access barriers average just 2.0% of residents living within 1 mile of a school, compared with 96.0% in the 25 strongest-access counties.
- The highest-barrier counties are overwhelmingly defined by geographic isolation. The 100 highest-barrier counties are all 100% rural, while the 100 strongest-access counties average just 1.9% rural residents.
- The highest-barrier counties are not just rural — they also tend to have thinner local service infrastructure. The 100 highest-barrier counties average 16.1% of workers employed in education, health care, and social assistance, compared with 26.3% in the 100 strongest-access counties. 87 of the 100 highest-barrier counties fall below 20% on this workforce measure.
- The counties with the greatest barriers are not low-need places, which raises the stakes of limited access. The 25 highest-barrier counties average a 27.7% child population, compared with 18.8% in the 25 strongest-access counties, suggesting demand remains meaningful where infrastructure is thinnest.
- Mental health provider availability generally tracks with overall access. Among counties with available provider data, the 100 highest-barrier counties average roughly 2,091 residents per provider, compared with about 293 residents per provider in the 100 strongest-access counties.
| Overall, the data shows that where a child lives still plays a major role in whether they can access timely support. But the findings also point toward a clear path forward. |
| For school systems, the implications are immediate. In the counties facing the steepest barriers, traditional in-person delivery models are more likely to produce longer waits, greater travel burdens, delayed evaluations, and higher strain on already-limited staff. That makes teletherapy and flexible staffing models not just innovative options, but practical access solutions. By expanding the reach of qualified specialists beyond county lines, reducing dependency on local hiring pools, and helping districts deliver services more consistently, teletherapy can play a direct role in narrowing the county-level access gaps this report reveals. |
Top 25 U.S. Counties Facing the Greatest Access Barriers
| Rank | County | State | Score |
|---|---|---|---|
| 1 | Loving | Texas | 89.15 |
| 2 | Stanton | Kansas | 82.33 |
| 3 | LaGrange | Indiana | 81.71 |
| 4 | Yoakum | Texas | 81.63 |
| 5 | Sherman | Texas | 81.28 |
| 6 | Hooker | Nebraska | 80.90 |
| 7 | Culberson | Texas | 80.87 |
| 8 | Cimarron | Oklahoma | 80.82 |
| 9 | Lake and Peninsula | Alaska | 80.51 |
| 10 | Sterling | Texas | 80.38 |
| 11 | Lander | Nevada | 80.32 |
| 12 | Holmes | Ohio | 80.29 |
| 13 | Faulk | South Dakota | 80.25 |
| 14 | Denali | Alaska | 80.21 |
| 15 | Clark | South Dakota | 80.05 |
| 16 | Millard | Utah | 79.99 |
| 17 | Fallon | Montana | 79.98 |
| 18 | Crane | Texas | 79.62 |
| 19 | Hamlin | South Dakota | 79.60 |
| 20 | Corson | South Dakota | 79.54 |
| 21 | De Baca | New Mexico | 79.35 |
| 22 | Davis | Iowa | 79.22 |
| 23 | Dewey | Oklahoma | 79.17 |
| 24 | Harding | South Dakota | 79.15 |
| 25 | Franklin | Idaho | 79.07 |
Top 25 U.S. Counties With the Strongest Access Conditions
| Overall Rank | County | State | Score |
|---|---|---|---|
| 3139 | Lexington | Virginia | 7.29 |
| 3138 | Charlottesville | Virginia | 11.12 |
| 3137 | Williamsburg | Virginia | 14.54 |
| 3136 | Suffolk | Massachusetts | 16.07 |
| 3135 | Bronx | New York | 17.23 |
| 3134 | New York | New York | 17.42 |
| 3133 | Philadelphia | Pennsylvania | 17.60 |
| 3132 | Richmond | New York | 17.75 |
| 3131 | St. Louis City | Missouri | 18.01 |
| 3130 | Baltimore City | Maryland | 18.11 |
| 3129 | Queens | New York | 18.98 |
| 3128 | Nassau | New York | 19.11 |
| 3127 | Kings | New York | 19.45 |
| 3126 | Orleans | Louisiana | 19.71 |
| 3125 | San Francisco | California | 19.85 |
| 3124 | Multnomah | Oregon | 21.33 |
| 3123 | Richmond City | Virginia | 21.38 |
| 3122 | Denver | Colorado | 21.39 |
| 3121 | Ramsey | Minnesota | 22.04 |
| 3120 | Norfolk | Virginia | 22.05 |
| 3119 | Bergen | New Jersey | 22.22 |
| 3118 | Winchester | Virginia | 22.40 |
| 3117 | Delaware | Pennsylvania | 44.42 |
| 3116 | Cook | Illinois | 22.60 |
| 3115 | Bristol | Rhode Island | 22.61 |
Teletherapy: A Practical Response
The data points to a consistent operational challenge: many of the counties facing the steepest barriers are unlikely to close access gaps quickly through local hiring alone. Where specialist supply is limited and travel distances are long, districts need delivery models that reduce the role geography plays in whether a student receives services.
For many district use cases, especially speech-language pathology, mental health support, school psychology, occupational therapy consultation, and other school-linked services, it can meaningfully expand reach, improve scheduling flexibility, and reduce the burden of hard-to-fill local roles.
| Recommended district actions Audit current access. Map where students face the longest waits, highest travel burden, or most persistent vacancy patterns, and use those findings to prioritize service redesign. Prioritize the most difficult-to-fill specialist roles first. Start with the areas where local recruitment is repeatedly unsuccessful or where travel demand makes in-person coverage fragile. Strengthen implementation, not just staffing. Successful teletherapy depends on scheduling discipline, student support at the point of service, compliance workflows, and clear communication with families and staff. Use teletherapy as a resilience strategy, not only an emergency measure. Flexible delivery should be part of long-term access planning. |
With stronger implementation systems and scalable teletherapy models, they can begin to reduce travel burden, close service gaps faster, and create more equitable access to specialist support for students.
At VocoVision, we offer education staffing solutions that allow school districts and their students to get access to the education and therapy services they need, regardless of location. Explore recruitment and staffing services with VocoVision to learn more.
| Download the Complete Dataset Access detailed data for every U.S. county and explore how access varies across your state or region. |
Methodology
To identify the U.S. counties where children may face the greatest barriers to school-based support services, VocoVision created a county-level index based on structural and geographic indicators tied to access to care.
The index uses four equally weighted factors. Each factor contributes 25 points, for a total possible score of 100. Higher scores indicate lower relative access to care; lower scores indicate stronger relative access conditions.
The most recent datasets available were used for each factor. For Connecticut, the most recent available data for its eight historical counties was used where applicable.
Indexed Factors
| Factor | Weight | Why it matters | Source |
|---|---|---|---|
| Percent of children living within 1 mile of a school | 25% | School proximity is a practical indicator of how reachable school-based services may be in everyday life. | CDC National Environmental Public Health Tracking Network |
| Decennial Census Demographic and Housing Characteristics File | 25% | Captures the extent to which geography itself may create longer travel distances, smaller provider networks, and harder recruitment conditions. | Decennial Census Demographic and Housing Characteristics File |
| Education, health care, and social assistance workforce | 25% | Acts as a proxy for local care-and-support infrastructure and the depth of service capacity available to families and districts. | U.S. Census Bureau American Community Survey |
| Percent of population below age 18 | 25% | Reflects the size of the child population that may need evaluations, intervention, or ongoing services. | Census Population Estimates Program |
Contextual indicators referenced in this report
- Rural classification (NCHS six-level urban-rural classification scheme).
- Uninsured children (Small Area Health Insurance Estimates).
- Adults reporting a lack of social and emotional support (Behavioral Risk Factor Surveillance System).
- Population-to-mental-health-provider ratio (CMS / National Provider Identification).
- These indicators provide context in county spotlights and interpretation, but they are not scored components of the core four-factor index.